
InfluxDB permite obtener métricas internas sobre su funcionamiento tales como estado de memoria heap, número de requests (y errores) a endpoints HTTP, series de datos almacenadas, duración media de querys, etc… Además si contamos con Grafana será muy sencillo representar estos datos.
En primer lugar tenemos que habilitar dichas métricas. En el fichero de configuración /etc/influxdb/influxdb.conf:
###
### Controls the system self-monitoring, statistics and diagnostics.
###
### The internal database for monitoring data is created automatically if
### if it does not already exist. The target retention within this database
### is called 'monitor' and is also created with a retention period of 7 days
### and a replication factor of 1, if it does not exist. In all cases the
### this retention policy is configured as the default for the database.

[monitor]
  # Whether to record statistics internally.
   store-enabled = true

  # The destination database for recorded statistics
   store-database = "_internal"

  # The interval at which to record statistics
   store-interval = "10s"
Una vez habilitado reiniciamos:
systemctl restart influxdb.service
En Grafana creamos un datasource de tipo InfluxDB que apunte a la instancia de Base de Datos _internal:
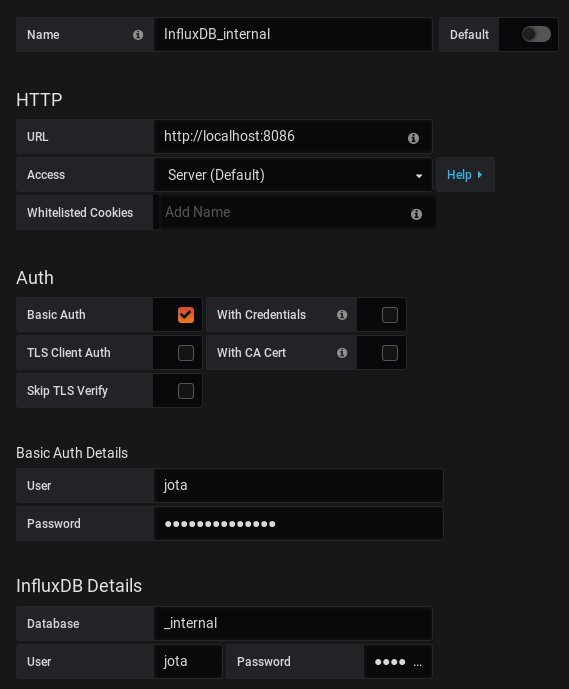
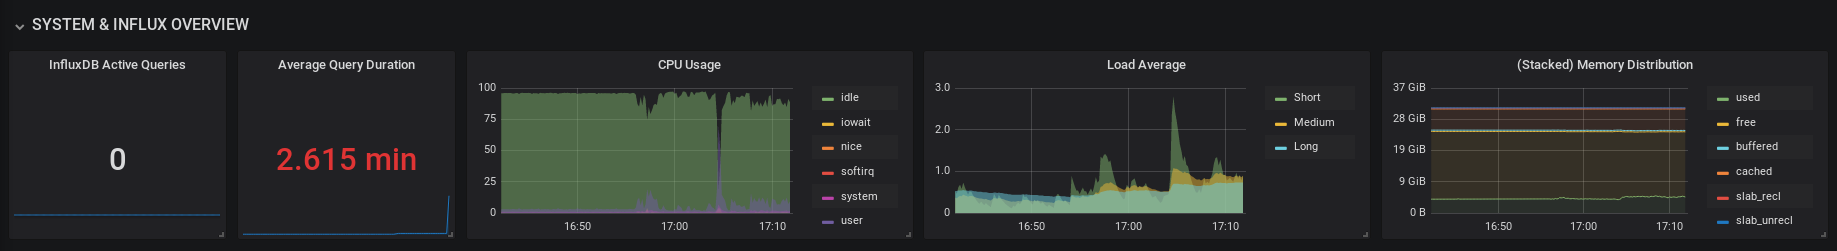
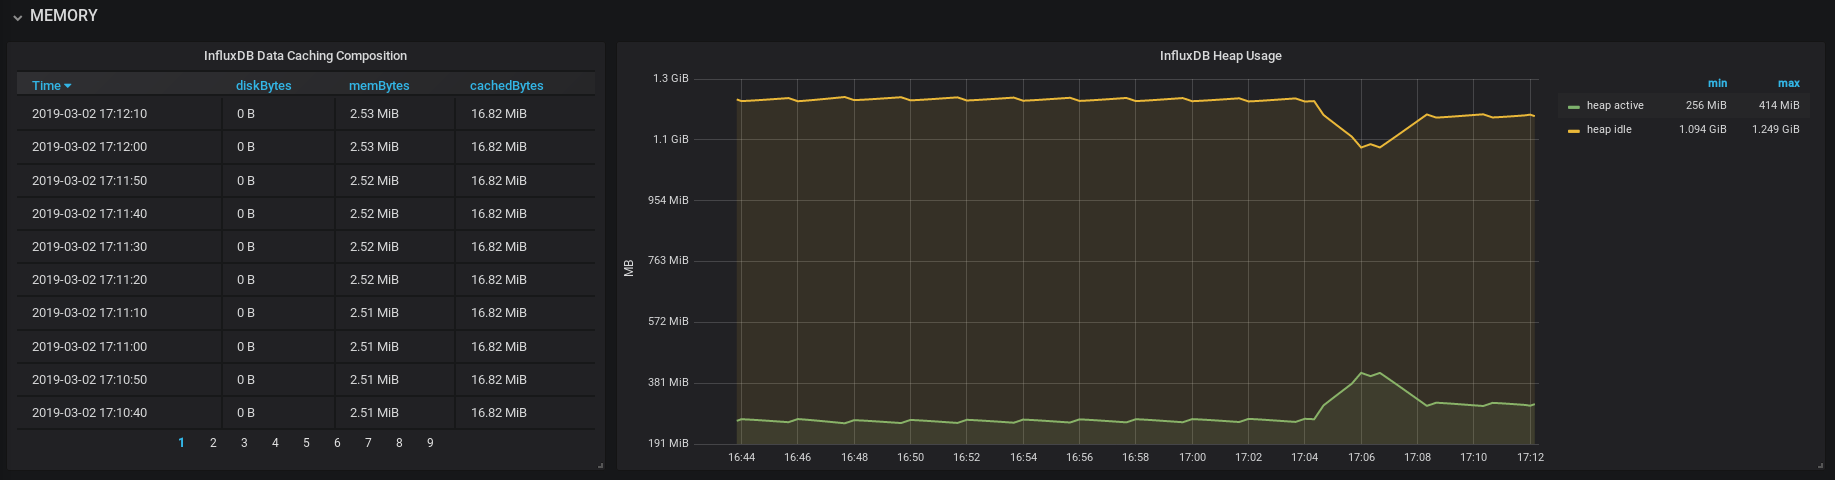
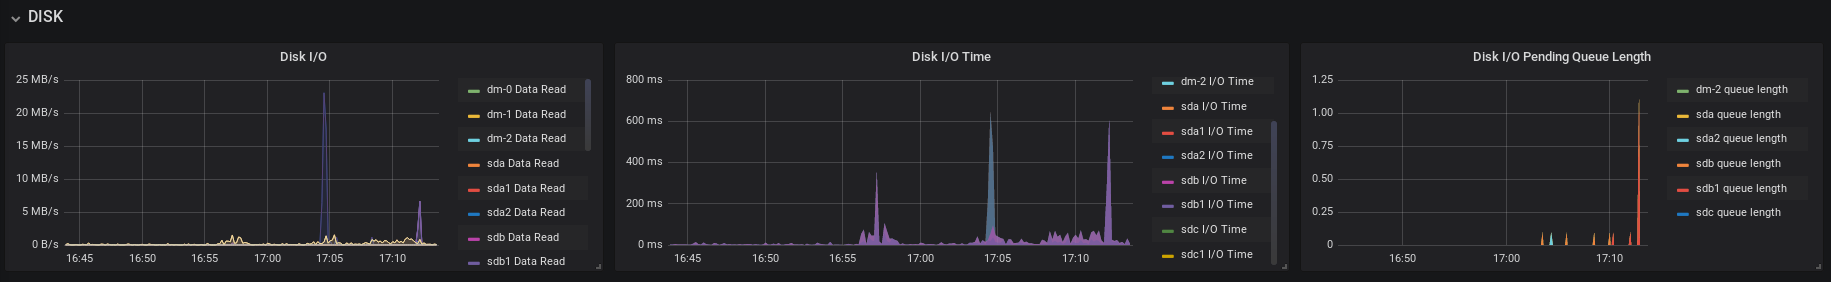
Una vez comprobado que el datasource conecta correctamente tendremos que crear un Dashboard para representar estos datos. En mi caso utilizo el siguiente, aunque con algunas modificaciones incluyendo paneles con métricas de sistema de CPU, memoria, carga, I/O en disco además de las específicas de InfluxDB.
En cuanto a las pruebas de carga, InfluxDB cuenta con la utilidad influx_stress. Por defecto lanza 2000 requests contra la instancia InfluxDB local de la máquina:
[root@jota-pc influxdb]# influx_stress
Total Requests: 2000
	Success: 2000
	Fail: 0
Average Response Time: 33.15087ms
Points Per Second: 464281

Total Queries: 250
Average Query Response Time: 5.592484ms
Sin embargo podemos parametrizar este test con un fichero de configuración, por ejemplo:
[provision]
  [provision.basic]
    enabled = true
    address = "127.0.0.1:8086"
    database = "stress"
    reset_database = true

[write]
  [write.point_generator]
    [write.point_generator.basic]
      enabled = true
      # The total number of points a stress_test will write is determined by multiplying the following two numbers:
      # point_count * series_count = total_points
      # Number of points to write to the database for each series
      point_count = 100
      # Number of series to write to the database?
      series_count = 100000
      # This simulates collection interval in the timestamps of generated points
      tick = "10s"
      # This must be set to true
      jitter = true
      # The measurement name for the generated points
      measurement = "cpu"
      # The generated timestamps follow the pattern of { start_date + (n * tick) }
      # This sequence is preserved for each series and is always increasing
      start_date = "2009-Jan-01"
      # Precision for generated points
      # This setting MUST be the same as [write.influx_client.basic]precision
      precision = "s"
      # The '[[]]' in toml format indicates that the element is an array of items.
      # [[write.point_generator.basic.tag]] defines a tag on the generated points
      # key is the tag key
      # value is the tag value
      # The first tag defined will have '-0' through '-{series_count}' added to the end of the string
      [[write.point_generator.basic.tag]]
        key = "host"
        value = "server"
      [[write.point_generator.basic.tag]]
        key = "location"
        value = "us-west"
      # [[write.point_generator.basic.field]] defines a field on the generated points
      # key is the field key
      # value is the type of the field
      [[write.point_generator.basic.field]]
        key = "value"
        # Can be either "float64", "int", "bool"
        value = "float64"

  # The [write.influx_client] defines what influx instances the stress_test targets
  [write.influx_client]
    [write.influx_client.basic]
      # This must be set to true
      enabled = true
      # This is an array of addresses
      # addresses = ["<node1_ip>:8086","<node2_ip>:8086","<node3_ip>:8086"] to target a cluster
      addresses = ["127.0.0.1:8086"] # to target an individual node
      # This database in the in the target influx instance to write to
      # This database MUST be created in the target instance or the test will fail
      database = "stress"
      # Write precision for points
      # This setting MUST be the same as [write.point_generator.basic]precision
      precision = "s"
      # The number of point to write to the database with each POST /write sent
      #batch_size = 5000
      batch_size = 500
      # An optional amount of time for a worker to wait between POST requests
      batch_interval = "0s"
      # The number of workers to use to write to the database
      # More workers == more load with diminishing returns starting at ~5 workers
      # 10 workers provides a medium-high level of load to the database
      concurrency = 10
      # This must be set to false
      ssl = false
      # This must be set to "line_http"
      format = "line_http"
Después podemos lanzar la prueba con la opción -config:
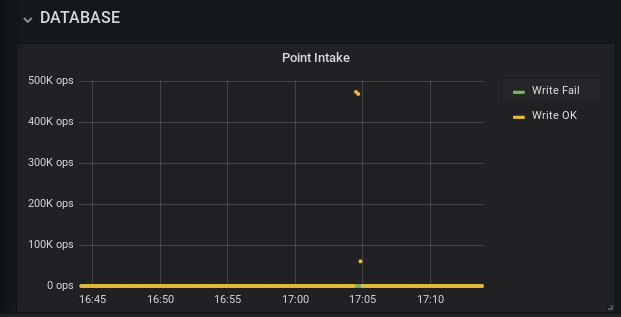
[root@jota-pc ~]# influx_stress -config influx_stress_test.toml
Total Requests: 20000
	Success: 20000
	Fail: 0
Average Response Time: 8.052222ms
Points Per Second: 491340
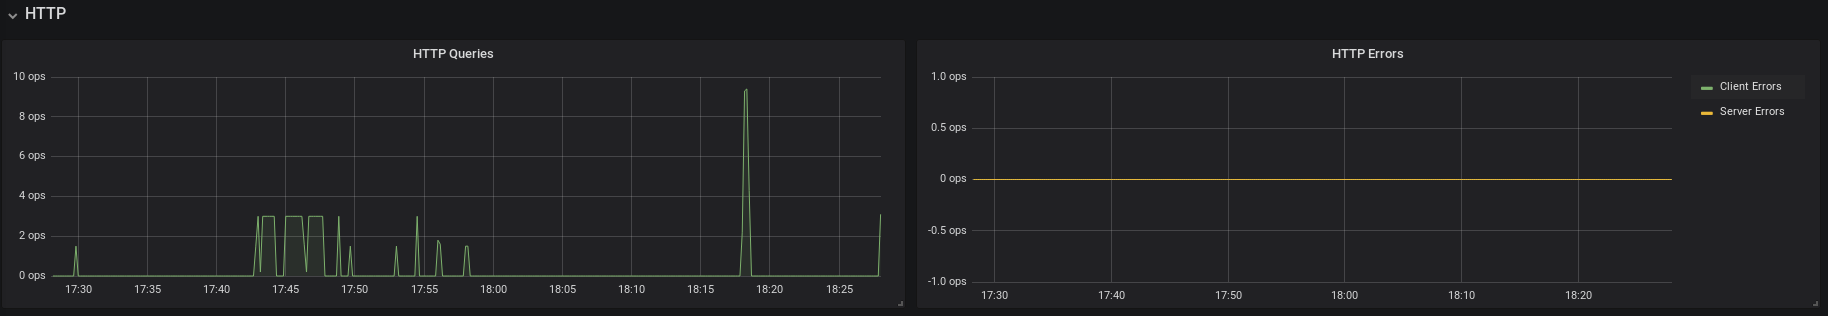
Si tenemos configurado anteriormente Grafana como comentaba, nos resultará muy útil para visualizar el impacto de las cargas y poder sacar conclusiones que nos ayuden a configurar de forma óptima la Base de Datos y el sistema en el que se encuentra.